Daily Forex Analysis – September 25, 2009
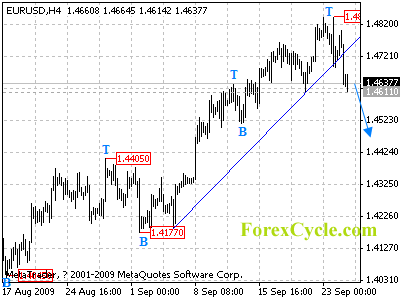
EURUSD Analysis.
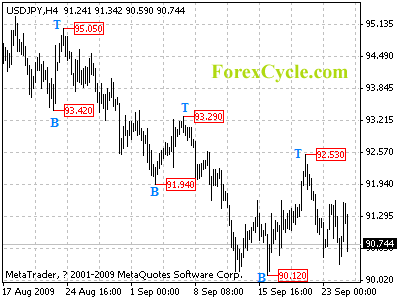
USDJPY Analysis.
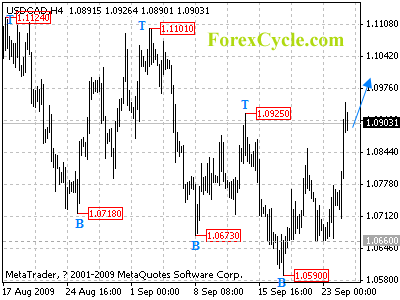
USDCAD Analysis.
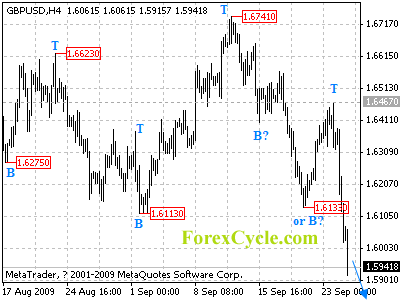
GBPUSD Analysis.
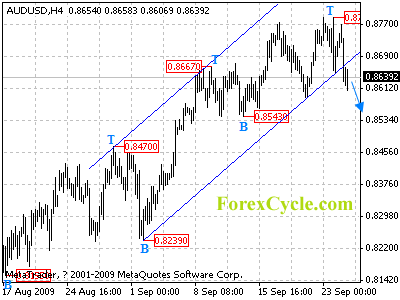
AUDUSD Analysis.
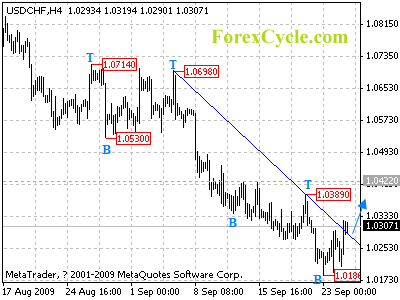
USDCHF Analysis.
SOURCE: forexcycle.com
Labels: DAILY FOREX ANALYSIS
Daily Forex Analysis – September 24, 2009
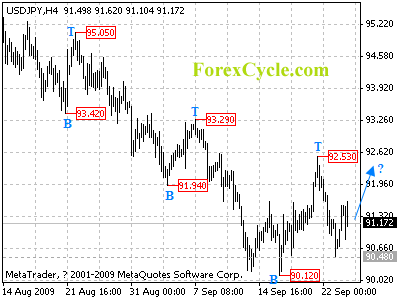
USDJPY Analysis.
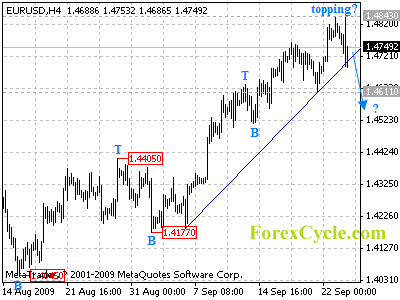
EURUSD Analysis.
USDCAD Analysis.
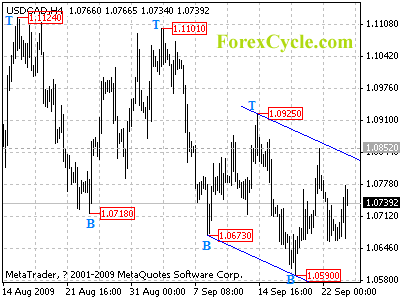
GBPUSD Analysis.
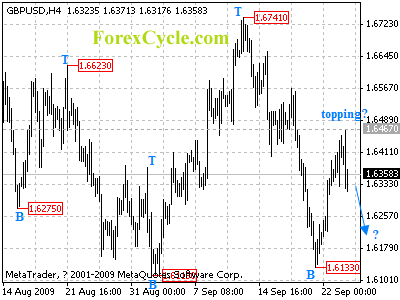
AUDUSD Analysis.
Being supported by the rising trend line on 4-hour chart, AUDUSD rebounds from 0.8651 level, suggesting that the pair remains in uptrend from 0.8155. Further rise is still possible to 0.8800 zone in a couple of days. However, a clear break below this trend line support will indicate that a short term cycle top is being formed, then consolidation in a range between 0.8543 and 0.8788 could be seen to follow.
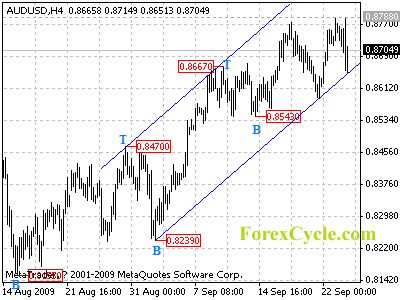
USDCHF Analysis.
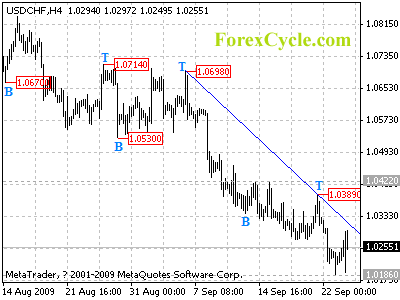
Labels: DAILY FOREX ANALYSIS
NOKIA MOBILE PHONE SECRET CODES
| Nokia code | Code function |
| *3370# | This Nokia code activates Enhanced Full Rate Codec (EFR) - Your Nokia cell phone uses the best sound quality but talk time is reduced my approx. 5% |
| #3370# | Deactivate Enhanced Full Rate Codec (EFR) |
| *#4720# | Activate Half Rate Codec - Your phone uses a lower quality sound but you should gain approx 30% more Talk Time |
| *#4720# | With this Nokia code you can deactivate the Half Rate Codec |
| *#0000# | Displays your phones software version, 1st Line : Software Version, 2nd Line : Software Release Date, 3rd Line : Compression Type |
| *#9999# | Phones software version if *#0000# does not work |
| *#06# | For checking the International Mobile Equipment Identity (IMEI Number) |
| #pw+1234567890+1# | Provider Lock Status. (use the "*" button to obtain the "p,w" and "+" symbols) |
| #pw+1234567890+2# | Network Lock Status. (use the "*" button to obtain the "p,w" and "+" symbols) |
| #pw+1234567890+3# | Country Lock Status. (use the "*" button to obtain the "p,w" and "+" symbols) |
| #pw+1234567890+4# | SIM Card Lock Status. (use the "*" button to obtain the "p,w" and "+" symbols) |
| *#147# | This lets you know who called you last (Only vodofone) |
| *#1471# | Last call (Only vodofone) |
| *#21# | This phone code allows you to check the number that "All Calls" are diverted to |
| *#2640# | Displays phone security code in use |
| *#30# | Lets you see the private number |
| *#43# | Allows you to check the "Call Waiting" status of your cell phone. |
| *#61# | Allows you to check the number that "On No Reply" calls are diverted to |
| *#62# | Allows you to check the number that "Divert If Unreachable (no service)" calls are diverted to |
| *#67# | Allows you to check the number that "On Busy Calls" are diverted to |
| *#67705646# | Phone code that removes operator logo on 3310 & 3330 |
| *#73# | Reset phone timers and game scores |
| *#746025625# | Displays the SIM Clock status, if your phone supports this power saving feature "SIM Clock Stop Allowed", it means you will get the best standby time possible |
| *#7760# | Manufactures code |
| *#7780# | Restore factory settings |
| *#8110# | Software version for the nokia 8110 |
| *#92702689# | Displays - 1.Serial Number, 2.Date Made, 3.Purchase Date, 4.Date of last repair (0000 for no repairs), 5.Transfer User Data. To exit this mode you need to switch your phone off then on again |
| *#94870345123456789# | Deactivate the PWM-Mem |
| **21*number# | Turn on "All Calls" diverting to the phone number entered |
| **61*number# | Turn on "No Reply" diverting to the phone number entered |
| **67*number# | Turn on "On Busy" diverting to the phone number entered |
| 12345 | This is the default security code |
press and hold # | Lets you switch between lines |
BASIC & ADVANCE TRADING STRATAGIES
Basic Trading Strategies
There are fundamental components for trading the Forex market. The first component is the Currency Pair. Here are key points to know:
- A currency pair consists of the base currency and the cross currency. The base currency is the first currency in a currency pair and the dominant of the two currencies.
- The base currency is equal to 1 unit of the cross currency monetary unit of exchange. Suppose the value of the EUR/USD is 1.1500, then 1 Euro is equal to 1.15 US Dollars. In other words, to buy 1 Euro will cost $1.15.
- In trading, the strength or weakness of the base currency in comparison to the cross currency generally determines the direction of the trade.
- When a currency pair rises in price, the base currency is gaining strength over the cross currency and traders may seek to trade Long.
- On the other hand, when the currency pair declines in price, the base currency is weakening compared to the cross currency and traders may seek Short positions.
Thus, a currency pair consists of one currency gaining strength while the other currency is weakening. So, when the US Dollar is weakening in the market, the Euro and Swiss Franc are strengthening; and, as a rule of thumb, the EUR/USD rises and the USD/CHF falls.
Understanding this relationship between the base currency and the cross currency leads to a couple of basic trading strategies: Parallel Strategy and Inverse Strategy.
Parallel Strategy - One of the easiest trading strategies is to follow pairs that tend to move in the same direction or parallel when the US Dollar strengthens or weakens.
- EUR/USD and GBP/USD

- USD/CHF and USD/JPY
- AUD/USD and NZD/USD
(Often when EUR/USD rises in price, the GBP/USD rises.)
Inverse Strategy - This strategy seeks to follow currency pairs that tend to move in the opposite direction or inverse when the US Dollar strengthens or weakens:
- EUR/USD and USD/CHF
- GBP/USD and USD/JPY
- AUD/USD and USD/CAD
(Generally, when EUR/USD rises in price, the USD/CHF falls.)
Even though some currency pairs tend to have parallel and inverse relationships which give traders exceptional trading opportunities, market conditions may exist at any given time that can affect currencies to react counter to normal tendencies. Therefore, avoid relying on a rule of thumb strategy without evaluating your trading parameters and current market conditions.
Another component of trading the Forex market is Price Action. It is key for a trader to recognize current price movement in relation to price support, price resistance, and overall market direction or trend. In doing so, price action may indicate potential trade setups which are additional trading strategies.
Buy Dips - As price trends upward, it has a tendency to retrace, pullback, or "dip-down" before resuming its upward direction. This retrace creates a temporary support level. If market up-trend and conditions remain, a trader can place a Long position at this support level.
Selling Bounces - As price trends down, it has a tendency to retrace or rise temporarily during its descent. This slight rise in price creates a temporary resistance in which price appears to bounce off similar to a ball bouncing off the ceiling of a room. In this case if market down trend and conditions remain, a trader can place a Short position at or near this temporary resistance.
Breakout Strategy - One of the most popular trading strategies, the Breakout is a strategy of monitoring a currency pair as it oscillates up and down in a narrow price range, then placing a trade depending upon the direction of the break of the range. A Long position can be placed if there is a break above the range; or, a Short position can be placed if a break below the range occurs. Usually, traders buy or sell after the price makes a move out of the range. Traders can either wait for a breakout to occur to place a trade or set an entry order to be executed in the event of a breakout of the range.
When considering a Breakout, a trader should evaluate the following:
- Has price remained in a narrow range for an extended period of time? The longer price remains flat or in a narrow range, the possibility of a breakout increases.
- What was the overall market direction or trend before the narrow range ? Often, when a breakout occurs, price continues in the direction of which it originated
AdvancedTrading Strategies
-
Breakout - One of the most popular trading strategies, the Breakout is a strategy of monitoring a currency pair as it oscillates up and down in a narrow price range, then placing a trade depending upon the direction of the break of the range. A Long position can be placed if there is a break above the range; or, a Short position can be placed if a break below the range occurs. Buying or selling usually occurs after the price makes a move out of the range. Traders can either wait for a breakout to occur to place a trade or set an entry order to be executed in the event of a breakout of the range. When considering a Breakout, a trader should evaluate the following possible trading techniques:
- Has price remained in a narrow range for an extended period of time? The longer price remains flat or in a narrow range, the possibility of a breakout increases.
- What was the overall market direction or trend before the narrow range? Often, when a breakout occurs, price continues in the direction of which it originated.

Channel Trading - When the market is in a range, resistance and support price points within the range can often be identified. Sometimes during a range-bound market, these price points are reached in succession. In this case, at a repeated resistance level, a trader can short the market if the trader feels the market will retrace down to the previous support level. And, in similar fashion at a repeated support level, a trader can place a long position. It's important for a trader to do a thorough analysis before executing a channel trade. A continuation of the range may make channel trading a favorable strategy; however, if the market breaks out the range, there is the possibility of a channel trade being placed in the wrong direction.

In this example above, there is a price range that is about 60 pips wide between the 2 red lines representing Support and Resistance. In the middle of the range, there is a magenta line used to identify the halfway point between Support and Resistance. For this strategy to work effectively there should be ample distance between Support and Resistance - at least enough to trade within. Too tight of a price range may be dangerous with this strategy.
Let’s walk through this example of a Channel Trade strategy:
First, wait for the setup. There needs to be a repeated move in price to a Support or Resistance level to trade. In this case, there is a repeated Support at # 3.
Then calculate the repeated distance from Support to Resistance. Also, mark the halfway point, which can be used as either a Limit (take profit) point if reached or as a Stop-Loss if price moves through.
At # 3 point, a trader can enter a Long trade with the expectancy for the trade to move up to the price level of # 2. In this case, however, price did not reach the Resistance of the range but hesitated at point A which is a little beyond the halfway point. In Channel Trading, be aware of price hesitation. This can be a sign for potential reversal. As price moves above the halfway point, a trader can set a Stop-Loss at that price level.
As the trader feels that price will not go higher, the trader can exit his Long position around point A and enter a Short position with the expectancy of the short to descend down towards Support represented by points # 1 and # 3.
At point B, the trader can exit the Short position and enter into another Long position with the expectancy for the trade to move up to the price level of # 2. In which it did at point C.
Then, the process is repeated if there still exist the conditions for channel trading. In this case, a trader might have traded points A, B, C, D, E and then F.
It's important for a trader to do a thorough analysis before executing a channel trade. For most traders, it requires a keen eye to the charts and a feel for the market. It’s typically most suited for an active trader. If you attempt this strategy, remember that a continuation of the range may make channel trading favorable; but, if the market breaks out the range, there is the possibility of a channel trade being in the wrong direction.
Hedge Trading - A trading strategy designed to possibly minimize adverse price movements during uncertainty of market direction. When considering a Hedge trade, a trader should evaluate the following possible trading techniques:
- Place a hedge trade on two parallel pairs in opposite direction such as trading the GBP/USD long and the EUR/USD short.
- Place a hedge trade on two inverse pairs in the same direction such as trading the EUR/USD long and the USD/CHF long.
- Place the same currency pair in opposite direction such as trading the EUR/USD long and the EUR/USD short.
- In all 3 scenarios, a trader can place the same stop loss and limit level on each trade. As the market moves in one direction, there is probable chance that one trade will be stopped while the other trade continues to a profitable limit.
Scalp Trading - This strategy is designed for active traders. Multiple trades are made for small gains. Each trade is held for a short period of time typically within a few minutes. The success of using this strategy depends in part to market volatility and a trader's ability to quickly enter and exit with minimal loss.
Straddle Trading - A trading strategy of setting entry stop orders above and below either a narrow range channel or resistance and support levels. Once one order has been filled, the trader can remove the other order. When considering a Straddle trade, a trader should evaluate the following possible trading techniques:
- Narrow range channel - an entry buy stop can be placed above and an entry sell stop can be placed below in the event price breaks out of either side of the channel.
- Resistance and Support - an entry buy stop can be placed above resistance and an entry sell stop can be placed below support in the event the market makes a push beyond either level.
Labels: FOREX TRADING

